Ten Charts That Make Clear The Planet Just Keeps Warming I Gráficos Vitales

Projected radiative forcing by ODSs, HFCs, low-GWP substitutes, and CO2 ( 12). The blue hatched region indicates what would have occurred in the absence of the Montreal Protocol, with 2 to 3% annual production increases in ODSs [data taken from ( 5)]. Added to the radiative forcing from ODSs [data from ( 9)] are the contributions from HFCs from the upper-range scenario [data from ( 11)]. Also shown are the radiative forcing from alternative scenarios in which substitution is made with chemicals having shorter lifetimes (lower GWPs); their contribution is calculated using methods described in ( 11) with the parameters from ( 16). Under the Montreal Protocol, use reductions started in 1989 for CFCs and in 1996 for HCFCs.
———————————–

Projected radiative forcing of climate by HFCs and CO2since 2000, when the influence of HFCs wasessentiallyzero. The HFC climate forcing for an upper range scenario iscomparedwith the CO2 forcing for the range of scenarios from IPCC-SRES and the 450 ppm CO2stabilization scenario. Clearly, the contribution of HFCs to radiative forcing couldbeverysignificant in the future; by 2050, itcouldbe as much as a quarter of that due to CO2increasessince 2000, if the upper range HFC scenario iscompared to the median of the SRES scenario. Alternatively, the contribution of HFCs to radiative forcing couldbe one-fifth the radiative forcing due to CO2increasessince 2000, if the upper range HFC scenario iscompared to the upper range of the SRES scenario. The contribution of HFCs to radiative forcing couldalsobe as much as 40% of the radiative forcing by CO2under the 450 ppm scenario. (UNEP 2011)
———————————–

Model simulation of atmospheric CO2concentration for >100,000 yearsfollowing a large CO2release from combustion of fossil fuels. Different fractions of the releasedgasrecover on differenttimescales. (NAP 2011.)
———————————–

Relative changes in radiative forcing (Upper) and warming (Lower) in the Bern 2.5CC model, for the sameassumed profile of increasing radiative forcing over 100 y, followed by a stop of emissions as in Fig. 3, for a range of greenhousegases of varyinglifetimes. The gasesconsidered are HFC-152a (1.4-y lifetime), methane (≈10-y lifetime), N2O (114-y lifetime), carbondioxide (seetext), and CF4 (50,000-y lifetime). All quantities are normalized to one whenemissions stop, in order to examine relative changes. (Solomonet al., PNAS 2010.)
———————————–

Qualitative sketch of the time-course of future temperatureundervarious scenarios for control of emissions of short-lived radiative forcing agents. The time axis isgiven as time since the beginning of significantanthropogenicemissions of greenhousegases. It isassumedthat CO2emissions are brought to zeroafter 200 years. SLPF refers to short-lived positive forcing agents, likemethane or black carbon on snow and ice. SLNF refers to short-livednegative forcing agents, primarilyaerosols. “Early Action” refers to a scenario in whichearly, aggressive action istaken to mitigateemission of short-lived radiative forcing agents, while “Deferred Action” refers to a scenario in whichsuch actions are delayed. The green line shows whathappens in the aggregate of all short-lived forcings broughtunder control originallyadded up to a coolingeffect (sothatreducingthemwarms the climate. The dashed green line issimilar, exceptthatit assumes thereis a residualmethaneemissionthatcannotbereduced to zero. The cumulative CO2emissions are assumed to be the same in all of these scenarios. (Solomon S. et al., NAS 2011.)
———————————–

Estimated global consumption of HFCs by various sectors, expressed in CO2 equivalent, for 1990, 2002 and 2010 (TEAP 2005, EPA 2010a). HFCs are predominantly used for the same industrial uses as the CFCs and HCFCs which are subject to phase-out under the Montreal Protocol. The rapid growth in HFCs after 1990 is also clearly evident.
———————————–

Based on IPCC, WG 1, Fig. 2.21, AR 4 (2007). (Note graph does not include all non-CO2forcers.)
———————————–

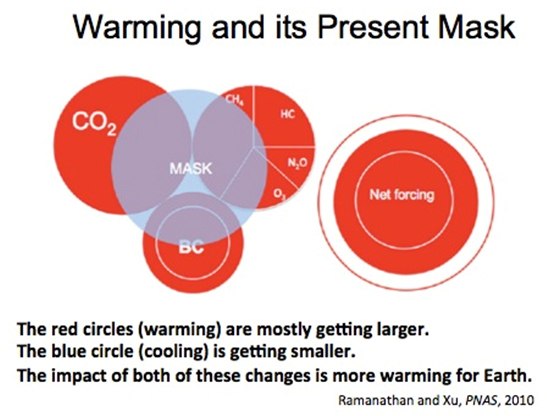
Area of eachred-shadedcircleisproportional to the energy addition frompreindustrial time to 2005. All the numbers, except the BC number, are takenfrom the article by Forster et al. (2001). Radiant energy addition by methaneincludes the production of stratospheric water vapor by methaneoxidation. Methaneisalsoresponsible for about 50% of the energy addition by ozone.(Ramanathan& Xu, PNAS 2010.)
———————————–

———————————–

The North American proposal and the Micronesianproposal are similar; bothdecrease the cumulative (2013-2050) direct GWP-weightedemissions of HFCs to 22-24 GtCO2-eq from 110-170 GtCO2-eq, for a total of ~87 to 146 GtCO2-eq in mitigation. This isequivalent to a reductionfromprojectedannualemissions of 5.5 to 8.8 GtCO2-eq/yr in 2050 to lessthan ~0.3 GtCO2-eq/yr. Prepared for IGSD by Dr. Guus Velders, based on Velders G. et al., PNAS (2009).
———————————–

———————————–

———————————–

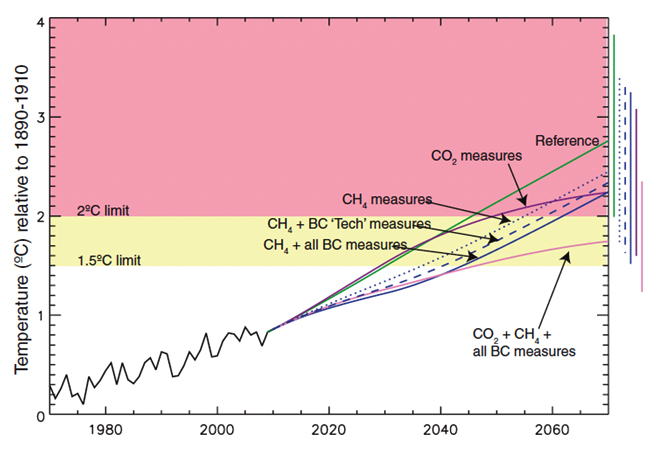
Observedtemperatures (42) through 2009 and premperaturesthereafterundervarious scenarios, all relative to the 1890–1910 mean. Results for future scenarios are the central values fromanalyticequationsestimating the response to forcings calculatedfrom composition-climatemodeling and literatureassessments (7). The rightmost bars give 2070 ranges, includinguncertainty in radiative forcing and climatesensitivity. A portion of the uncertaintyissystematic, sothatoverlapping ranges do not meanthereis no significantdifference (Shindell et al., SCI 2012 and UNEP-WMO 2011, based onRamanathan& Xu, Fig 1D, PNAS 2010.)
———————————–

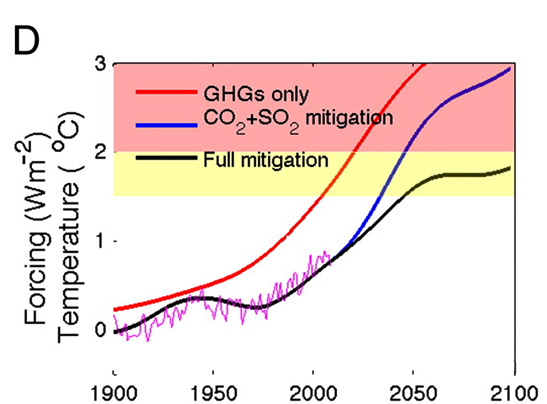
The red line depictsstrong mitigation of CO2 (peaking in 2015 and remainingat 2015 levelsuntil 2100, reaching a concentration peak of 430 ppm by 2050), but no mitigation of non-CO2greenhousegases, and does not account for forcing fromaerosols or land use change; the blue line is the same as the red line exceptitincludeswarming and coolingaerosol forcing and the mitigation of cooling sulfate aerosols; the black line is the same as the blue line exceptitincludes mitigation of all SLCPsincluding HFCs; the pink and yellow backgrounds show zones beyond 2°C and 1.5°C. (Ramanathan& Xu, Fig 1D, PNAS 2010.)
———————————–
